


Stocks were narrowly higher for the week as investors digested mixed economic news about consumer confidence. All three of the major averages posted gains for Q1 2024.
Stocks Finish Strong
Markets slipped for the first half of the four-day week as investors took a breather after the prior week’s gain. Conflicting economic news on Monday and Tuesday contributed to the slide. New home sales in February slipped 0.3 percent over the prior month but increased by 5.9 percent from the prior year. Durable goods orders—everything from washing machines to helicopters—rebounded 1.4 percent in February, beating expectations and recouping some of January’s 6.9 percent drop.1,2,3
Stocks rallied on Wednesday, including a fresh record close for the Standard & Poor’s 500. An upward revision to consumer sentiment on Thursday helped the rally along. The markets are closed on Friday when the much-anticipated inflation report called the Personal Consumption and Expenditures (PCE) is released, which could set up a volatile Monday.4
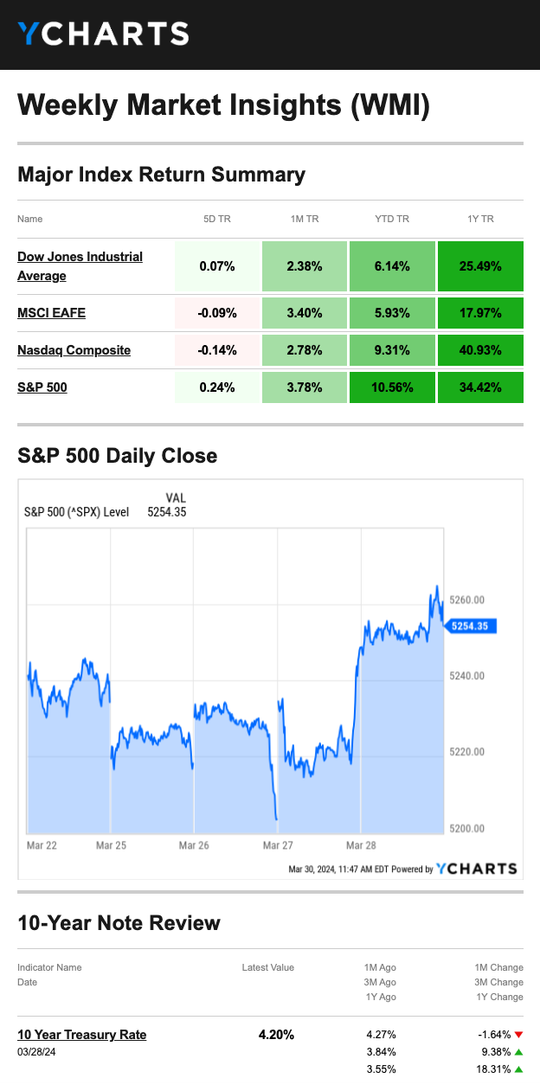
| Source: YCharts.com, March 30, 2024. Weekly performance is measured from Friday, March 22, to Thursday, March 28. ROC 5 = the rate of change in the index for the previous 5 trading days. TR = total return for the index, which includes any dividends as well as any other cash distributions during the period. Treasury note yield is expressed in basis points. |
Doubters and Believers
Getting a straightforward read on consumers this week was challenging. The Conference Board reported on Tuesday that its Consumer Confidence Index remained essentially unchanged—as it has for the past six months—showing consumers were generally pessimistic about the future.
But on Thursday, the University of Michigan’s consumer-sentiment survey showed consumer confidence hit a 2½-year high in March. It suggested that consumers had gained more confidence that inflation would drop and alleviate some pressure on household finances. Friday’s PCE report may give some additional insights into consumer confidence.5,6
This Week: Key Economic Data
Monday: ISM Manufacturing Index. PMI Manufacturing Final. Construction Spending.
Tuesday: Motor Vehicle Sales. Factory Orders. JOLTS.
Wednesday: ADP Employment Report. EIA Petroleum Status Report. ISM Services Index.
Thursday: Jobless Claims. International Trade in Goods & Services. Fed Balance Sheet. Natural Gas Report.
Friday: Employment Situation. Consumer Credit.
Source: Investors Business Daily – Econoday economic calendar; March 27, 2024
The Econoday economic calendar lists upcoming U.S. economic data releases (including key economic indicators), Federal Reserve policy meetings, and speaking engagements of Federal Reserve officials. The content is developed from sources believed to be providing accurate information. The forecasts or forward-looking statements are based on assumptions and may not materialize. The forecasts also are subject to revision.
This Week: Companies Reporting Earnings
Tuesday: Paychex, Inc. (PAYX)
Wednesday: Levi Strauss & Co. (LEVI)
Thursday: Conagra Brands (CAG)
Source: Zacks, March 27, 2024
Companies mentioned are for informational purposes only. It should not be considered a solicitation for the purchase or sale of the securities. Investing involves risks, and investment decisions should be based on your own goals, time horizon, and tolerance for risk. The return and principal value of investments will fluctuate as market conditions change. When sold, investments may be worth more or less than their original cost. Companies may reschedule when they report earnings without notice.
1. The Wall Street Journal, March 28, 2024
2. CNBC.com, March 25, 2024
3. Reuters, March 26, 2024
4. CNBC.com, March 26, 2024
5. MarketWatch.com, March 28, 2024
6. The Conference Board, March 26, 2024
7. IRS.gov, October 23, 2023
8. SilverSneakers.com, December 21, 2023
Investing involves risks, and investment decisions should be based on your own goals, time horizon, and tolerance for risk. The return and principal value of investments will fluctuate as market conditions change. When sold, investments may be worth more or less than their original cost.
The forecasts or forward-looking statements are based on assumptions, may not materialize, and are subject to revision without notice.
The market indexes discussed are unmanaged, and generally, considered representative of their respective markets. Index performance is not indicative of the past performance of a particular investment. Indexes do not incur management fees, costs, and expenses. Individuals cannot directly invest in unmanaged indexes. Past performance does not guarantee future results.
The Dow Jones Industrial Average is an unmanaged index that is generally considered representative of large-capitalization companies on the U.S. stock market. Nasdaq Composite is an index of the common stocks and similar securities listed on the NASDAQ stock market and is considered a broad indicator of the performance of technology and growth companies. The MSCI EAFE Index was created by Morgan Stanley Capital International (MSCI) and serves as a benchmark of the performance of major international equity markets, as represented by 21 major MSCI indexes from Europe, Australia, and Southeast Asia. The S&P 500 Composite Index is an unmanaged group of securities that are considered to be representative of the stock market in general.
U.S. Treasury Notes are guaranteed by the federal government as to the timely payment of principal and interest. However, if you sell a Treasury Note prior to maturity, it may be worth more or less than the original price paid. Fixed income investments are subject to various risks including changes in interest rates, credit quality, inflation risk, market valuations, prepayments, corporate events, tax ramifications and other factors.
International investments carry additional risks, which include differences in financial reporting standards, currency exchange rates, political risks unique to a specific country, foreign taxes and regulations, and the potential for illiquid markets. These factors may result in greater share price volatility.
Please consult your financial professional for additional information.
This content is developed from sources believed to be providing accurate information. The information in this material is not intended as tax or legal advice. Please consult legal or tax professionals for specific information regarding your individual situation. This material was developed and produced by FMG Suite to provide information on a topic that may be of interest. FMG is not affiliated with the named representative, financial professional, Registered Investment Advisor, Broker-Dealer, nor state- or SEC-registered investment advisory firm. The opinions expressed and material provided are for general information, and they should not be considered a solicitation for the purchase or sale of any security.
Copyright 2024 FMG Suite.